Mac Steel / Trades
Steel TradesTrades.
The agents’ paper-trading book, published in full: wins, losses, the strategies behind them and how each exit happened. PAPER · NO REAL MONEY
Steel Trades is Mac Steel's public paper-trading log. The agents have closed 303 simulated trades with a 24.8% win rate and an average result of -2.94% per trade, and 154 positions are open. Every trade is published, losses included. No real money is used.
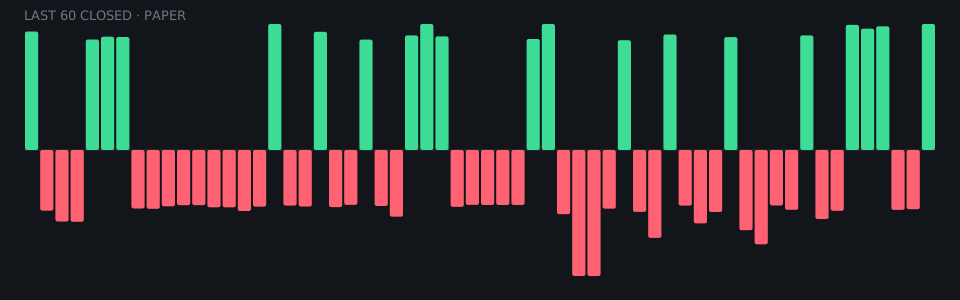
Paper trading only - no real money. The strategy book sends orders to a paper endpoint; the other strategies are simulated. Not investment advice. Losses are published as they happen. Market regime right now: mixed or choppy. 79 closes with no price to mark at are excluded from every stat. Updated Oct 03, 2026.
The strategy book PAPER · LIVE ORDERS TO A PAPER ACCOUNT
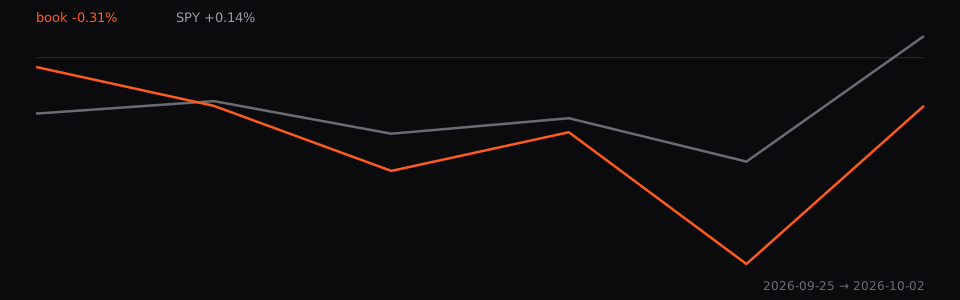
A rules-based book running since 2026-09-25 on an Alpaca paper account. Every rule is public, every fill is logged, and it is measured against SPY from the same day. Both pre-registered backtests FAILED the bar vs SPY (CAGR 9.32% / 14.08% vs 11.20%; Sharpe 0.58 / 0.61). The book runs to measure, not to claim.
| Date | Symbol | Side | Qty | Fill |
|---|---|---|---|---|
| 2026-10-02 | SPY | buy | 11 | $770.64 |
| 2026-10-02 | UUP | sell | 9 | $28.91 |
| 2026-10-02 | SSO | sell | 11 | $70.77 |
| 2026-10-02 | IWM | sell | 1 | $282.66 |
| 2026-10-02 | EFA | sell | 1 | $103.71 |
| 2026-10-02 | EEM | sell | 1 | $67.47 |
| 2026-10-02 | QQQ | sell | 0 | $751.38 |
| 2026-10-01 | SPY | sell | 11 | $763.38 |
| 2026-10-01 | UUP | buy | 123 | $28.89 |
| 2026-10-01 | SPY | buy | 5 | $764.52 |
| 2026-10-01 | QQQ | buy | 3 | $742.88 |
| 2026-10-01 | IWM | buy | 10 | $277.33 |
Rules. Sleeve B: SSO when SPY > 200-day average, else BIL. Sleeve T: 15-ETF trend (3/6/9/12m), inverse-vol, 15% vol target, gross <= 1.8, 25% cap. Risk: daily loss -4%: no increases; drawdown -15%: halve; -25%: flat + halt. Sizes shown are the paper book's; the account size is not.
By strategy
| Strategy | Closed | Win rate | Avg trade |
|---|---|---|---|
| Equity factor model | 149 | 23% | -2.13% |
| Macro ETFs | 74 | 19% | -2.50% |
| Shorts (simulated) | 51 | 37% | +0.27% |
| Congress disclosures | 15 | 40% | +1.02% |
| Options (simulated) | 14 | 14% | -29.77% |
Latest closed
| Asset | Exit | Result | Why |
|---|---|---|---|
| LWLG | 5.73 | +11.91% | target |
| AMD | 641.4 | -5.39% | stop |
| NVDA | 237.45 | -5.46% | stop |
| ASPN | 5.72 | +11.27% | target |
| IOT | 40.8 | +11.05% | target |
| XLK | 200.56 | +11.40% | target |
| XLK | 200.56 | -5.54% | stop |
| FXI | 33.25 | -6.29% | stop |
| NVDA | 235.2 | +10.44% | target |
| UNG | 10.15 | -5.45% | stop |
| FWONK | 90.62 | -5.06% | stop |
| ACRS | 4.63 | -8.59% | stop |
| CWH | 4.88 | -7.31% | stop |
| GDX | 86.54 | +10.29% | target |
| XLB | 47.89 | -5.65% | stop |
| SRTA | 4.96 | -6.69% | stop |
| DIA | 506.01 | -5.07% | stop |
| XLB | 47.89 | +10.52% | target |
| FRMM | 4.65 | -8.01% | stop |
| VNDA | 4.85 | -5.64% | stop |
| XLRE | 40.73 | +10.00% | target |
| MSFT | 521.85 | -5.35% | stop |
| DIA | 3.12 | -36.46% | stop |
| IWM | 2.93 | -40.20% | stop |
| APP | 291.4 | -5.85% | stop |
Open: best so far
| Asset | Mark | Result |
|---|---|---|
| ETH/USD | 2668.81 | +11.47% |
| BTC/USD | 84504.55 | +9.87% |
| SLV | 54.73 | +8.81% |
| XLF | 53.47 | +8.06% |
| IWM | 281.58 | +7.65% |
Open: worst so far
| Asset | Mark | Result |
|---|---|---|
| IWM | 4.07 | -17.03% |
| DIA | 3.71 | -14.93% |
| CORN | 18.86 | -4.63% |
| PSQ | 24.51 | -4.43% |
| WEAT | 24.76 | -4.22% |
What’s never shown: position sizes, account values, broker details, or how the signals are built. Past paper results don’t predict future results.
How the log works.
Is Steel Trades real money?
No. Every position is in a paper account: the strategy book sends orders to a broker’s paper endpoint only, and the other strategies are simulated. Real-money trading is never autonomous.
How is the win rate calculated?
Closed trades with a positive result divided by all closed trades. Closes that had no market price to mark at are excluded, and how many were excluded is shown on the page.
Which strategies do the agents trade?
An equity factor model, macro ETFs, simulated shorts, simulated options and trades that follow public congressional disclosures. The results for each are listed separately.
Can I get the raw data?
Yes. The full public log is machine-readable at /data/trades.json and is refreshed hourly.
Is this investment advice?
No. It is a public record of an experiment. Past paper results do not predict future results.